
| 일 | 월 | 화 | 수 | 목 | 금 | 토 |
|---|---|---|---|---|---|---|
| 1 | 2 | 3 | 4 | |||
| 5 | 6 | 7 | 8 | 9 | 10 | 11 |
| 12 | 13 | 14 | 15 | 16 | 17 | 18 |
| 19 | 20 | 21 | 22 | 23 | 24 | 25 |
| 26 | 27 | 28 | 29 | 30 | 31 |
Tags
- 에트리 인턴
- 딥러닝
- 에이블스쿨
- cnn
- SQL
- dx
- httr
- 가나다영
- Eda
- 지도학습
- ML
- r
- kt aivle school
- hadoop
- Ai
- ETRI
- 머신러닝
- arima
- ggplot2
- KT AIVLE
- 하계인턴
- 시계열
- 한국전자통신연구원 인턴
- 소셜네트워크분석
- SQLD
- 기계학습
- python
- 다변량분석
- 프로그래머스
- 서평
- kaggle
- matplot
- KT 에이블스쿨
- 한국전자통신연구원
- 에이블러
- 하둡
- 빅분기
- 웹크롤링
- 시각화
- 빅데이터분석기사
Archives
- Today
- Total
소품집
[다변량 분석] Survey Data를 이용한 다변량분석 본문
728x90
setwd('/Users/dayeong/Desktop/21-2/전공/다변량 분석')
# 범주형 데이터 분석
# MASS 패키지의 내장된 데이터(survey) 활용
library(MASS)
library(ggplot2)
data_s <- survey
View(data_s)
?survey
# 독립 표본 t-검정(1)
# Pulse - Sex
var.test(Pulse~Sex, data=data_s)
boxplot(Pulse~Sex, data=data_s, main='Sex ~ Pulse BoxPlot')
t.test(Pulse~Sex, data=data_s, var.equal=T)
var.test(Height~Sex, data=data_s)
t.test(Height~Sex, data=data_s,var.equal=F )
# anova 분석-1
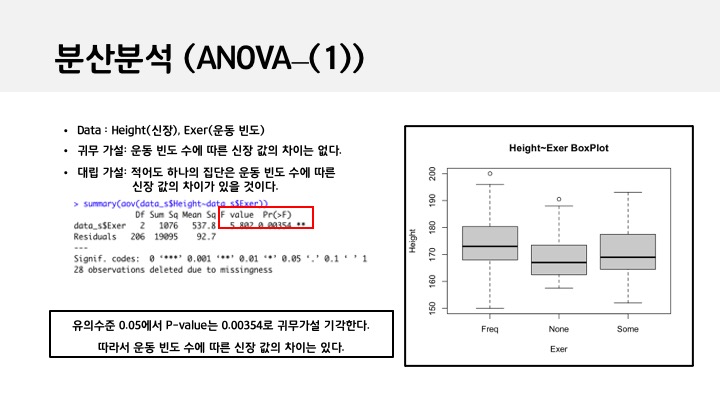
summary(aov(data_s$Height~data_s$Exer))
boxplot(Height~Exer, data=data_s, main='Height~Exer BoxPlot')
summary(aov(data_s$Age~data_s$Exer))
# anova 분석-2
summary(data_s$Age)
summary(aov(data_s$Age~data_s$Exer))
boxplot(Age~Exer, data=data_s, main='Age~Exer BoxPlot')
# 적합성 검정(1)
table(data_s$Exer)
Exer <- table(data_s$Exer)
ration <- c(0.48,0.1,0.42)
chisq.test(x=Exer, p=ration)
98/(115+24+98)
# 동질설 검정(1)
a.n <- table(data_s$Sex, data_s$W.Hnd)
prop.table(a.n)
addmargins(prop.table(a.n))
chisq.test(a.n)
plot(a.n, main='Sex-Smoke Ration')
# 독립성 검정
a.n <- table(data_s$Sex, data_s$Smoke)
prop.table(a.n)
addmargins(prop.table(a.n))
chisq.test(a.n)
plot(a.n, main='Sex-Smoke Ration')수정본(HW01)다변량분석-20181478소다영 (1).pdf
0.71MB


728x90
'Statistics' 카테고리의 다른 글
| [다변량 분석] 모형 적합성, 회귀계수 유의성 검정, 결정계수(R^2) 해석 (0) | 2021.10.13 |
|---|---|
| [다변량 분석] 캐글 Mushrooms Data Classification (2) | 2021.09.29 |
| [다변량 분석] 검정 및 신뢰구간 추정 (1) | 2021.09.29 |
| statistics (2) | 2020.12.05 |
| p-value and 신뢰구간 (0) | 2020.12.01 |
'Statistics' Related Articles
more


Comments